import numpy as npimport matplotlib.pyplot as pltimport statsmodels.api as smimport pandas as pdimport mathfrom functools import partialfrom typing import Iterable, Callable, Optionalfrom numbers import Number
class PredictionTask:def __init__ (self , input , outcome= None ):self .A = input self .B = outcomeclass WeightedPredictionClass:def __init__ (self , tasks: Iterable[PredictionTask], weights: Optional[Iterable[Number]] = None ):self .tasks = tasksfor task in self .tasks:if task.B is None :raise ValueError ("All WeightedPredictionClass task outcomes must be known." )= len (tasks)if weights is not None :if len (weights) != J:raise ValueError (f"len(weights), { len (weights)} , must equal len(tasks), { J} " )self .weights = np.array(weights) / sum (weights)else :self .weights = np.ones(J)/ Jdef predictive_success(self , predicted_log_likelihood: Callable[[PredictionTask], float ]) -> float :return sum (w * predicted_log_likelihood(task) for w, task in zip (self .weights, self .tasks)if task.B is not None )
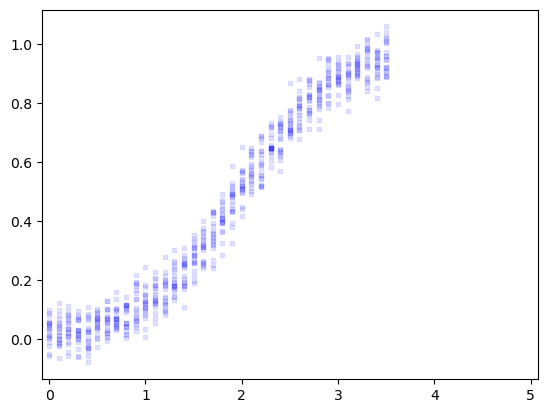
def generate_x(x_range, step= 0.1 , copies= 20 ):= np.round (np.arange(x_range[0 ], x_range[1 ] + step, step), decimals= 1 )= np.tile(x_values, copies)return np.sort(repeated_x_values)def generate_y(x, noise_std= 0.0 ):"""Generates data based on the specified model.""" = 0.5 + 0.5 * np.tanh(x - 2 )if noise_std:+= np.random.normal(0 , noise_std, size= len (x))return y
# Set the seed for replicability = sum (ord (char) for char in "Rumpelstiltskin" )= generate_x((0 , 3.5 ), copies= 20 )= generate_y(x0, noise_std= 0.05 )= pd.DataFrame({'x' : x0, 'y' : y_known})def make_task(in_range, out_range) -> PredictionTask:= df[(df['x' ] >= in_range[0 ]) & (df['x' ] <= in_range[1 ])]['x' ].values= df[(df['x' ] >= in_range[0 ]) & (df['x' ] <= in_range[1 ])]['y' ].values= df[(df['x' ] >= out_range[0 ]) & (df['x' ] <= out_range[1 ])]['x' ].values= df[(df['x' ] >= out_range[0 ]) & (df['x' ] <= out_range[1 ])]['y' ].valuesreturn PredictionTask(dict (x_known= x_known,= y_known,= x_to_predict,
= make_task((0 , 3.5 ), (3.6 , 5 ))'x_known' ], task_of_interest.A['y_known' ], label= "TRUE" , = "blue" , marker= 's' , s= 10 , alpha= 0.1 )- 0.075 , 5.075 )#plt.ylim(-0.2, 1.2)
= WeightedPredictionClass([make_task((0 , 2.5 ), (2.6 , 3.5 ))])
Define predictive methods
def log_likelihood(y_pred, y, sigma2) -> float :"""Average log-likelihood""" = math.pi= math.log= np.mean((y_pred - y)** 2 )return - (1 / 2 )* (ln(2 * pi* sigma2) + MSE/ sigma2)
statsmodels documentation:
def predicted_ll(model_name, task: PredictionTask) -> float := task.A['x_known' ]= task.A['y_known' ]= task.A['x_to_predict' ]= sm.OLS(y, design_matrix(model_name, x)).fit()= fit_results.predict(design_matrix(model_name, x_out))return log_likelihood(y_pred, task.B, fit_results.mse_resid)def design_matrix(model_name, x):if model_name == "Poly-4" := np.column_stack([np.ones(len (x)), x, x** 2 , x** 3 , x** 4 ])elif model_name == "Poly-3" := np.column_stack([np.ones(len (x)), x, x** 2 , x** 3 ])elif model_name == "Poly-2" := np.column_stack([np.ones(len (x)), x, x** 2 ])elif model_name == "Poly-1" := np.column_stack([np.ones(len (x)), x])elif model_name == "Poly-0" := np.column_stack([np.ones(len (x))])else :raise NotImplementedError (model_name)return X= ["Poly-0" , "Poly-1" , "Poly-2" , "Poly-3" , "Poly-4" ]
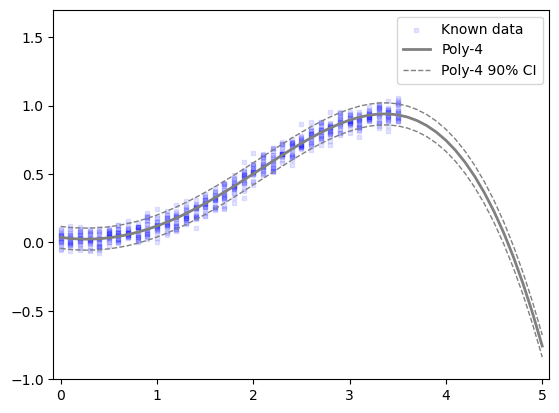
= generate_x((0 , 5 ), copies= 1 )= sm.OLS('y_known' ],"Poly-4" , task_of_interest.A['x_known' ]),= fit_results4.predict(design_matrix("Poly-4" , x_all)) = fit_results4.mse_resid** 0.5 'x_known' ], task_of_interest.A['y_known' ], = "Known data" , color= "blue" , marker= 's' , s= 10 , alpha= 0.1 )= "Poly-4" , color= "gray" , linewidth= 2 )+ 1.645 * y4_std, label= f"Poly-4 90% CI" , color= "gray" , linestyle= '--' , linewidth= 1 )- 1.645 * y4_std, color= "gray" , linestyle= '--' , linewidth= 1 )- 0.075 , 5.075 )- 1.0 , 1.7 )
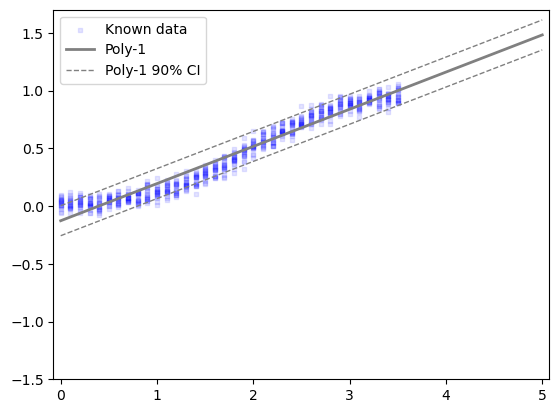
= sm.OLS('y_known' ],"Poly-1" , task_of_interest.A['x_known' ]),= fit_results1.predict(design_matrix("Poly-1" , x_all))= fit_results1.mse_resid** 0.5 'x_known' ], task_of_interest.A['y_known' ], = "Known data" , color= "blue" , marker= 's' , s= 10 , alpha= 0.1 )= "Poly-1" , color= "gray" , linewidth= 2 )+ 1.645 * y1_std, label= f"Poly-1 90% CI" , color= "gray" , linestyle= '--' , linewidth= 1 )- 1.645 * y1_std, color= "gray" , linestyle= '--' , linewidth= 1 )- 0.075 , 5.075 )- 1.5 , 1.7 )
= [pclass_single.predictive_success(partial(predicted_ll, model_name)) for model_name in sim_models]
[np.float64(-2.870443608400252),
 np.float64(0.8788369626883851),
 np.float64(-18.63054717541598),
 np.float64(-4.984451316175962),
 np.float64(-9.054374407164836)]
for ll in scores_single]
[0.056673780037751864,
 2.4080973700308568,
 8.10692521752496e-09,
 0.006843531932783001,
 0.00011687864225465167]
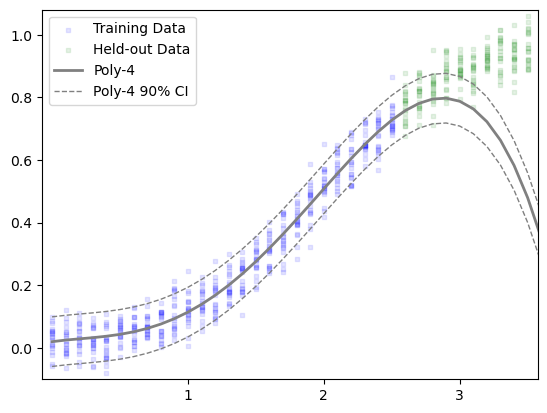
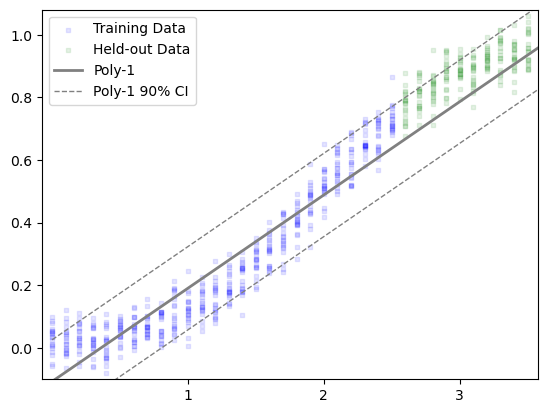
def plot_predicted_centrality(model_name, task):"""Plot predicted line (over full 0-3.5 domain) over scatter plot of the _to_predict data""" = generate_x((0 , 5 ), copies= 1 )= sm.OLS('y_known' ],'x_known' ]),= fit_results.predict(design_matrix(model_name, x_all))= fit_results.mse_resid** 0.5 'x_known' ], task.A['y_known' ], label= "Training Data" , = "blue" , marker= 's' , s= 10 , alpha= 0.1 )'x_to_predict' ], task.B, label= "Held-out Data" , = "green" , marker= 's' , s= 10 , alpha= 0.1 )= model_name, color= "gray" , linewidth= 2 )+ 1.645 * y_std, label= f" { model_name} 90% CI" , color= "gray" , linestyle= '--' , linewidth= 1 )- 1.645 * y_std, color= "gray" , linestyle= '--' , linewidth= 1 )- 0.075 , 3.575 )- 0.1 , 1.08 )1 , 2 , 3 ])# plt.yticks([0.2, .4, .6, 0.8, 1.0])
"Poly-4" , make_task((0 , 2.5 ), (2.6 , 3.5 )))
"Poly-1" , make_task((0 , 2.5 ), (2.6 , 3.5 )))
Alternate Prediction Class
= 0.1 = []for i in range (0 , 10 ):= round (3.4 - step * i, 1 )0 , cal_end), (3.5 , 3.5 )))print (len (tasks))0 , 2.5 ), (2.6 , 3.4 )))= WeightedPredictionClass(tasks)= [pclass.predictive_success(partial(predicted_ll, model_name)) for model_name in sim_models]
[np.float64(-2.1386458322914335),
 np.float64(1.2209215151126325),
 np.float64(-21.46668435058918),
 np.float64(-2.831988084630039),
 np.float64(-11.741231148018695)]
for ll in scores]
[0.1178142753356378,
 3.3903105169322107,
 4.754856797504306e-10,
 0.05889564766842201,
 7.95880935336731e-06]
def run_gen_simulation(tasks, models):"""Runs the simulation and returns the results.""" = {}for model_name in models:= {}= []for i, task in enumerate (tasks):= str (i)= {"ll_score" : predicted_ll(model_name, task)#"x": x, # Store x and y for plotting #"y": y, + [results_dict[model][range_name]["ll_score" ] for range_name in names] for model in models]))return results_dict
= run_gen_simulation(tasks, sim_models)
0
Poly-0
-1.118959
-1.227402
-1.365171
-1.533124
-1.713439
-1.959911
-2.281350
-2.649863
-3.139755
-3.765091
-2.771038
1
Poly-1
1.233698
1.191902
1.182461
1.195612
1.190609
1.238881
1.307212
1.347694
1.374178
1.340330
0.827560
2
Poly-2
-0.571892
-2.300498
-4.594007
-7.515809
-14.061439
-20.442990
-26.869498
-38.200259
-48.352409
-59.089634
-14.135093
3
Poly-3
1.489999
1.517216
1.513580
1.503340
0.742634
-0.258117
-0.942742
-5.363093
-10.247458
-17.515067
-3.592161
4
Poly-4
0.866315
0.475567
-1.056968
-5.035622
-3.192154
-5.625011
-17.819549
-17.041277
-27.987432
-48.011620
-4.725792
= np.exp(np.mean(np.array([[results_gen2[model][range_name]["ll_score" ] for range_name in results_gen2[model]] for model in sim_models]), axis= 1 ))
array([1.17814275e-01, 3.39031052e+00, 4.75485680e-10, 5.88956477e-02,
       7.95880935e-06])
array([3.47502905e-02, 1.00000000e+00, 1.40248416e-10, 1.73717562e-02,
       2.34751635e-06])