---
title: "Handling 100% scores in the Bayesian ECI"
subtitle: "A simple fix for the ECI's new sensitivity to Epoch's 99.9% clip"
description: "Epoch's switch to a Bayesian ECI makes some results of interest depend on how benchmark scores of 0 or 1 are clipped (to 0.001 or 0.999), but extending the beta distribution to handle scores of exactly 0 or 1 provides similar results without the clip's arbitrariness."
date: 2026-11-12
image: featured.png
image-alt: "How far Claude Fable 5.2 sits above the reasoning-era frontier trend under each clip: from +3.4 ECI points at a 1% clip to +6.8 at 10⁻¹²."
draft: false
toc: true
execute:
echo: false
warning: false
date-modified: 2026-11-16
---
```{python}
#| include: false
# Every number this post quotes is read from files in this folder, computed from Epoch's Nov 10, 2026 data. The code
# that computes them, with the fits' outputs, is at https://github.com/hugetim/eci-clip-replication (run_all.sh):
# clip_table.csv, bench_sigma.csv, fit_metrics.csv, post_stats.json: scripts/clip_post_assets.py
# (Epoch's model refit at each clip, and XB)
# xb_shift.json: scripts/xb_shift_post_assets.py (XB with delta tied to sigma_b)
# xbx.json: scripts/xbx_post_assets.py (Kosmidis and Zeileis's XBX)
# fable_gap.csv, fable_gap_lines.csv: scripts/clip_trend_gap.py
# ls_clip_table.csv: scripts/ls_clip_sweep.py (Epoch's original least-squares ECI at each clip)
# astra_sol_scores.csv, astra_sol_panel.html and astra_sol_panel_curves.csv: viz/pair_panel.py
import json
from types import SimpleNamespace
import numpy as np
import pandas as pd
ASTRA, SOL = "GPT-6 Astra", "GPT-6.1 Sol"
# ---- Data
st = SimpleNamespace(**json.load(open("post_stats.json"))) # scalar results, read as st.name
fit = pd.read_csv("fit_metrics.csv").set_index("measure") # Epoch's fit measures, both models
shift = SimpleNamespace(**json.load(open("xb_shift.json"))) # XB with delta tied to sigma_b
xbx = SimpleNamespace(**json.load(open("xbx.json"))) # Kosmidis and Zeileis's XBX, as a check on XB
scores = pd.read_csv("astra_sol_scores.csv") # Astra's and Sol's scores, with Epoch's published ECI
published = scores.groupby("model").ECI.first()
sigma_b = pd.read_csv("bench_sigma.csv").set_index("benchmark") # each benchmark's fitted scatter under each fit
mystery = sigma_b.loc["Mystery Game Puzzles"]
mystery_weight_loss = 1 - (mystery["clip_0.001"] / mystery["clip_0.0001"]) ** 2 # at a 0.01% clip; weight ~ 1 / sigma_b^2
# Astra against 6.1 Sol under each fit, restated from 6.1 Sol's side, and how far models at ECI 150+ move from Epoch's
# 0.1% clip. One row per clip (loosest first), and the extended-support beta's (XB's) row.
by_fit = pd.read_csv("clip_table.csv")
by_fit["sol_minus_astra"], by_fit["p_sol_over_astra"] = -by_fit.astra_minus_sol, 1 - by_fit.p_astra_over_sol
clips = by_fit[by_fit.model == "clip"].set_index("clip").sort_index(ascending=False)
xb = by_fit[by_fit.model == "XB"].iloc[0]
epoch, clip_1pct, clip_001pct, clip_1e12 = (clips.loc[c] for c in (0.001, 0.01, 0.0001, 1e-12)) # Epoch's clip is 0.1%
flip = clips.index[clips.sol_minus_astra > 0].max() # loosest clip at which 6.1 Sol is ahead
# Claude Fable 5.2's gap above the reasoning-era frontier trend (Nov 10 data), one row per fit: "Epoch published", the
# clip refits (base = Epoch's 0.1%, renamed clip_0.001 here), "XB". Columns 5.2_gap etc.; see scripts/clip_trend_gap.py.
gap = pd.read_csv("fable_gap.csv").set_index("source").rename({"base": "clip_0.001"})
gap_lines = pd.read_csv("fable_gap_lines.csv").replace({"source": {"base": "clip_0.001"}})
fable = gap["5.2_gap"] # the gap by fit, e.g. fable["clip_0.01"]
gap_ratio = fable["clip_1e-12"] / fable["clip_0.01"]
gap_per_tenfold = (fable["clip_1e-12"] - fable["clip_1e-08"]) / 4 # still growing at the tightest clips
# XB against my rerun of Epoch's model: Fable 5.2's ECI under each, and that its move is the largest at ECI 150+
above_interval = fable > gap["5.2_pi_hi"] # is Fable 5.2 above the trend's 90% prediction interval?
assert not above_interval[["Epoch published", "clip_0.01", "clip_0.001", "XB"]].any() # the text says: inside for these,
assert above_interval[[s for s in gap.index if s.startswith("clip_") and float(s[5:]) <= 1e-4]].all() # above from 0.01% on
fable_eci = gap["5.2_eci"]
assert abs((fable_eci["clip_0.001"] - fable_eci["XB"]) - xb.frontier_max_abs_change) < 0.01
assert xb.frontier_mean_abs_change > clips.frontier_mean_abs_change.max() # XB moves them more than any clip does
# Epoch's original least-squares ECI (benchmark-stitching fit.py, ridge 0.1) refit at each clip on the same Nov 10 data,
# point estimates only: one row per clip; fable_gap is Fable 5.2's gap above the same reasoning-era trend (refit per
# clip). See scripts/ls_clip_sweep.py.
ls = pd.read_csv("ls_clip_table.csv").set_index("clip").rename(columns={"astra_minus_sol": "sol_trails_astra"})
ls_tight = ls[ls.index <= 1e-4] # 0.01% through 10^-12
assert np.ptp(ls_tight.fable_gap) < 0.05 and np.ptp(ls_tight.sol_trails_astra) < 0.005 # one value covers them all
# ---- Text
def fmt(x, spec=".2f"):
"""A number as text, with a true minus sign."""
return format(x, spec).replace("-", "−")
def out_of_fm4(share):
"""A FrontierMath Tier 4 score as problems solved, e.g. 40/41."""
return f"{round(share * st.fm4_questions)}/{st.fm4_questions}"
def nines_label(n):
"""The score with n nines: 99%, 99.9%, 99.99%, ..."""
return "99" + ("." + "9" * (n - 2) if n > 2 else "") + "%"
def clip_label(c, html=False):
"""A clip as a percent (1%, 0.1%, 0.01%) or, below that, a power of ten: 10⁻⁵ in superscript characters, or with
html=True as 10<sup>−5</sup> (for tables; inline `{python}` text and chart hovers show HTML tags literally)."""
if c >= 1e-4:
return f"{c * 100:g}%"
power = str(-int(round(np.log10(c))))
return f"10<sup>−{power}</sup>" if html else "10⁻" + power.translate(str.maketrans("0123456789", "⁰¹²³⁴⁵⁶⁷⁸⁹"))
def md_table(df):
"""A DataFrame of already-formatted text as a Markdown table (for an `output: asis` cell)."""
head = "| " + " | ".join(df.columns) + " |\n|" + "---|" * len(df.columns) + "\n"
return head + "\n".join("| " + " | ".join(str(v) for v in r) + " |" for r in df.itertuples(index=False))
# ---- Figures: Plotly, one code cell per figure, placed where the figure appears
import plotly.graph_objects as go
from IPython.display import HTML, display
INK, MUTED, GRID = "#333", "#777", "#e6e6e6"
BLUE, ORANGE = "#2a6fdb", "#d9822b"
ASTRA_COL, SOL_COL = "#D85A30", "#5B57D1" # as in the benchmark chart (astra_sol_panel.html)
CLIP_BLUES = {0.01: "#9ec5f0", 0.001: "#6aa3e6", 0.0001: "#3b7fd4", 1e-6: "#1f5fae", 1e-12: "#0d3a75"} # light = loose
def style(fig, height, **layout):
"""The look shared by every figure: white background, light grid, no legend, no Plotly toolbar clutter."""
layout = {"margin": dict(l=70, r=20, t=10, b=50), **layout} # a figure may pass its own margin
fig.update_layout(height=height, template="plotly_white", showlegend=False, hovermode="closest",
font=dict(family="system-ui, sans-serif", size=13, color=INK), **layout)
fig.update_xaxes(gridcolor=GRID, zeroline=False, linecolor=MUTED, ticks="outside")
fig.update_yaxes(gridcolor=GRID, zeroline=False, linecolor=MUTED, ticks="outside")
return fig
CONFIG = dict(displaylogo=False, responsive=True, modeBarButtons=[["toImage", "resetScale2d"]])
def plotly_js():
"""plotly.js as one inline script, printed once (by an `output: asis` cell) before the first figure, so the post loads
no scripts from elsewhere. Quarto adds require.js to pages with Jupyter output; with it present, plotly.js would
register as a module instead of defining the global Plotly, so require's define is hidden while plotly.js loads."""
import plotly.offline
return ("<script>window._eciDefine = window.define; window.define = undefined;</script>\n<script>"
+ plotly.offline.get_plotlyjs() + "</script>\n<script>window.define = window._eciDefine;</script>")
def show(fig):
"""Put a figure in the page (plotly.js itself comes from plotly_js())."""
display(HTML(fig.to_html(full_html=False, include_plotlyjs=False, config=CONFIG)))
```
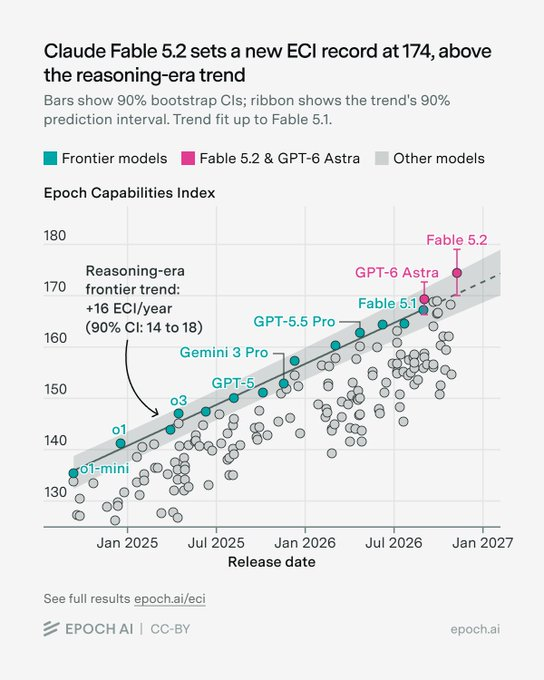
The Epoch Capabilities Index (ECI) has become the canonical measure of progress in AI capabilities.^[For example, Ethan Mollick's ["30 Months on the Exponential (in Charts)"](https://www.oneusefulthing.org/p/30-months-on-the-exponential-in-charts) (October 20) uses the ECI for its two initial charts showing the pace of frontier model progress. Likewise, Anthropic's internal version of the ECI is central to METR's [recent report on AI R&D acceleration there](https://metr.org/blog/2026-11-05-anthropic-ai-rd-acceleration-assessment/) (November 5).] It stitches together benchmarks of different difficulties, allowing the seamless addition of the new, harder benchmarks required by rapidly advancing capabilities. Its transparent, elegant math has helped make it a trusted measure. When Epoch recently [announced](https://x.com/EpochAIResearch/status/2119903415363113088) that Claude Fable 5.2's ECI was "above what the pre-Astra trend for reasoning models would have predicted," the ensuing conversation (rightly) took for granted that the underlying methodology is sound.
, CC BY). Fable 5.2 sits at the upper edge of the trend's shaded 90% prediction interval.](epoch_fable_trend.png){#fig-epoch width=60% fig-alt="Scatter plot of models' ECI against release date, with a trend line through the frontier reasoning models and a shaded band around it. Claude Fable 5.2, at 174, is above the line, at the top edge of the band."}
There is, however, one ad hoc aspect of Epoch's methodology that has seemed to me to detract from its elegance (though I could not come up with a better alternative myself). The underlying math can't handle benchmark scores of exactly 100% (or 0%), so Epoch ["clips" such scores](https://epoch.ai/data/eci-documentation/methodology#bayesian-set-up) to 99.9% (or 0.1%). Though the arbitrariness of this choice bothered me, I came to understand that the choice of which particular number close to 100% they used had no meaningful effect on the resulting ECI estimates---under the original least-squares methodology, that is.
Epoch's November 4 [shift to a Bayesian methodology](https://epoch.ai/publications/eci-bayesian-methodology),^[The primary motivation for changing methodologies seems to be the benefits a Bayesian model provides in terms of better grounded error bounds and improved model comparisons, which I agree are alone well worth the change.] however, deliberately made small score differences near 100% (or 0%) matter more than they had under the original methodology.^["The previous frequentist methodology, which minimized the squared prediction error, is comparable to a Bayesian model with a normal distribution that has the same noise for every predicted score. When using least-squares minimization, predicting 50% against an observed 55% is penalized just as much as predicting 90% against 95%. However, it seems reasonable to expect the noise to shrink as the predicted score gets close to 0 or 100%."] The way the original ECI seemed to underweight scores near 100% seemed a genuine shortcoming (which I had also tried but struggled to address myself), but fixing it has introduced an unintended side effect. The inevitably arbitrary choice of which number near 100% to clip perfect scores to now meaningfully impacts certain results of interest.
## How 100% scores are clipped moves Fable 5.2's ECI
In particular, the choice of clip impacts how far above the prior trend Fable 5.2 lands. Its `{python} fmt(fable["clip_0.001"], ".1f")` point jump with Epoch's 0.1% clip would instead be `{python} fmt(fable["clip_0.01"], ".1f")` points with a 1% clip, or up to `{python} fmt(fable["clip_1e-12"], ".1f")` points with a 10<sup>−12</sup> clip, `{python} fmt(gap_ratio, ".0f")` times the 1% clip's result.^[Under the extended-support beta (XB) proposed below, Fable is `{python} fmt(fable["XB"], ".1f")` ECI points above trend, also inside the trend's 90% prediction interval.] The jump would be even higher for clips still closer to the actual scores of exactly 100% (or 0%).^[One might think the clip should be as small as possible, since 99.9999% is closer to a true 100% than 99.9% is. But the results do not settle down as the clip shrinks: at 10<sup>−12</sup>, Fable 5.2's gap is still growing by about `{python} fmt(gap_per_tenfold, ".1f")` points with each tenfold tightening. Alternatively, one could argue for a larger clip proportionate to benchmarks' resolutions based on their question counts. (FrontierMath Tier 4 has `{python} st.fm4_questions` questions.)]
Whether the jump lands outside the trend's 90% prediction interval also depends on the clip. With Epoch's 0.1% clip, Fable 5.2 sits just inside the interval's upper edge, as in Epoch's chart. With a 0.01% clip or tighter, it lands above the interval. That said, the size of the jump is fairly stable for clips near Epoch's choice of 0.1%.
```{python}
#| output: asis
print(plotly_js())
```
```{python}
#| label: fig-gap
#| fig-cap: "Claude Fable 5.2's ECI from a full refit using the given clip, minus that fit's own trend prediction at Fable 5.2's release date. Each line is one fit's reasoning-era frontier trend (best reasoning models on release, o1-mini through Claude Fable 5.1, as in Epoch's chart), with its 90% prediction interval shaded. The extended-support beta (XB, described below) gap rounds to the 1% clip’s."
# Each fit's trend line, relative to its own prediction at Fable 5.2's release (fable_gap_lines.csv: days from that
# release, the line, and the 90% prediction interval's edges lo and hi relative to the line, computed as Epoch's
# ribbon is: see prediction_band in scripts/clip_trend_gap.py). Solid through Fable 5.1, the last model in the trend.
GAP_FITS = [("clip_0.01", 0.01, "1% clip (and XB)"), ("clip_0.001", 0.001, "0.1% clip (Epoch’s)"),
("clip_0.0001", 0.0001, "0.01% clip"), ("clip_1e-06", 1e-6, "10⁻⁶ clip"), ("clip_1e-12", 1e-12, "10⁻¹² clip")]
RELEASE = pd.Timestamp("2026-11-09") # Fable 5.2
FABLE51 = pd.Timestamp("2026-09-01")
def translucent(hex_color, alpha=0.12):
"""A #rrggbb color as rgba() text with the given opacity."""
r, g, b = (int(hex_color[i:i + 2], 16) for i in (1, 3, 5))
return f"rgba({r},{g},{b},{alpha})"
# per fit: its trend line (with dates), its row of fable_gap.csv, its color and its label
drawn = []
for source, clip, label in GAP_FITS:
line = gap_lines[gap_lines.source == source]
drawn.append((line.assign(date=RELEASE + pd.to_timedelta(line.days, unit="D")), gap.loc[source], CLIP_BLUES[clip], label))
fig = go.Figure()
for line, _, color, _ in drawn: # 90% prediction bands first, so every line sits on top of every band
fig.add_scatter(x=line.date, y=line.y + line.hi, mode="lines", line=dict(width=0), hoverinfo="skip") # upper edge
fig.add_scatter(x=line.date, y=line.y + line.lo, mode="lines", line=dict(width=0), fill="tonexty", # lower edge, filled up
fillcolor=translucent(color), hoverinfo="skip")
for line, _, color, label in drawn:
fitted, extended = line[line.date <= FABLE51], line[line.date >= FABLE51 - pd.Timedelta(days=5)]
for part, dash in ((fitted, "solid"), (extended, "dash")):
fig.add_scatter(x=part.date, y=part.y, mode="lines", line=dict(color=color, width=2, dash=dash),
name=label, hovertemplate=f"{label}<br>%{{x|%b %-d}}: %{{y:+.1f}}<extra></extra>")
for _, g, color, label in drawn: # dots on top of every line
fig.add_scatter(x=[RELEASE], y=[g["5.2_gap"]], mode="markers",
marker=dict(size=12, color=color, line=dict(color="white", width=1.5)),
hovertemplate=(f"<b>{label}</b><br>Fable 5.2: {g['5.2_eci']:.1f}<br>trend predicts {g['5.2_pred']:.1f}"
f"<br>gap {g['5.2_gap']:+.2f} (90%: {g['5.2_gap_lo']:+.1f} to {g['5.2_gap_hi']:+.1f})"
f"<br>trend’s 90% prediction interval: {g['5.2_pi_lo']:+.1f} to {g['5.2_pi_hi']:+.1f}"
f"<br>trend slope {g['slope']:.1f} ECI/yr<extra></extra>"))
# labels to the right of the dots, nudged apart where the dots are close (0.1% and 1% are 0.6 points apart)
label_y = []
for _, g, _, label in drawn:
y = g["5.2_gap"]
label_y.append(max(y, label_y[-1] + 0.8) if label_y else y)
fig.add_annotation(x=RELEASE + pd.Timedelta(days=8), y=label_y[-1], text=f"{y:+.1f} {label}", showarrow=False,
xanchor="left", font=dict(size=12))
fig.add_annotation(x=RELEASE + pd.Timedelta(days=8), y=label_y[-1] + 0.6, yanchor="bottom", xanchor="left", align="left",
showarrow=False, font=dict(size=12), text="<b>Alternative<br>Fable 5.2 ECIs</b>") # what the dots are
slopes = gap.loc[[s for s, _, _ in GAP_FITS], "slope"]
fig.add_annotation(x=pd.Timestamp("2026-03-10"), y=-1.6, xanchor="left", align="left", showarrow=False, font=dict(size=12),
text=f"Reasoning-era frontier trend, refit under each clip<br>(+{slopes.min():.1f} to +{slopes.max():.1f} ECI/yr; fit through Fable 5.1)")
fig.add_vline(x=RELEASE, line=dict(color=MUTED, width=1))
fig.add_hline(y=0, line=dict(color=MUTED, width=1, dash="dot"))
style(fig, 460, xaxis=dict(range=[pd.Timestamp("2026-03-01"), pd.Timestamp("2027-01-25")], # just room for the labels at the post's 805px
tickvals=pd.date_range("2026-03-01", "2026-11-01", freq="2MS"), tickformat="%b %Y"),
yaxis=dict(range=[-9.5, 10], tickvals=list(range(-8, 9, 2)),
ticktext=[f"{v:+d}".replace("-", "−") if v else "0" for v in range(-8, 9, 2)],
title="ECI points above the trend’s prediction"))
show(fig)
```
The reason Fable 5.2's score shifts relative to others is that it boasts a perfect score on both FrontierMath Tier 4 and FrontierMath Tiers 1–3,^[Epoch now considers its score of 95% on the latter the maximum possible.] out of only 10 benchmark scores currently available for Fable 5.2. Smaller clips therefore pull Fable 5.2's ECI higher relative to models without these perfect scores, as explained further in the following sections.
Using the original least-squares methodology (my refit of Epoch's earlier code on the same data), however, the impact of different clip values is barely perceptible: Fable 5.2 lands `{python} fmt(ls.loc[0.01, "fable_gap"], ".2f")` ECI points above the trend at a 1% clip, `{python} fmt(ls.loc[0.001, "fable_gap"], ".2f")` at 0.1%, and `{python} fmt(ls_tight.fable_gap.iloc[-1], ".2f")` at every clip from 0.01% to 10<sup>−12</sup>.
## The clip choice also shifts Sol v. Astra
GPT-6.1 Sol similarly benefits relative to other models from smaller clips due to its rare perfect score on FrontierMath Tier 4. In the official ECI, GPT-6.1 Sol narrowly trails GPT-6 Astra by `{python} fmt(-epoch.sol_minus_astra, ".2f")` ECI points, with probability `{python} fmt(epoch.p_sol_over_astra, ".0%")` that Sol is actually ahead.^[These numbers are from [my rerun of Epoch's code](https://github.com/hugetim/eci-clip-replication) (needed to vary the clip). Epoch publishes Astra `{python} fmt(published[ASTRA])` and Sol `{python} fmt(published[SOL])`.] Moving the clip to `{python} clip_label(flip)` is enough to give GPT-6.1 Sol the edge, and clips still closer to the actual scores of 0% and 100% widen its lead.^[Using the original least-squares methodology (my refit of Epoch's earlier code on the current data), I confirmed that the clip barely matters: 6.1 Sol trails Astra by `{python} fmt(ls.loc[0.01, "sol_trails_astra"])` ECI points at a 1% clip, `{python} fmt(ls.loc[0.001, "sol_trails_astra"])` at 0.1%, and `{python} fmt(ls_tight.sol_trails_astra.iloc[-1])` at every clip from 0.01% to 10<sup>−12</sup>.]
```{python}
#| output: asis
print(md_table(pd.DataFrame({
"Clip": [clip_label(c, html=True) for c in clips.index],
"6.1 Sol − Astra": [fmt(v, "+.2f") for v in clips.sol_minus_astra],
"P(6.1 Sol ahead of Astra)": [fmt(v) for v in clips.p_sol_over_astra],
})))
```
The probability that 6.1 Sol is ahead of Astra rises from `{python} fmt(clip_1pct.p_sol_over_astra)` at a 1% clip to `{python} fmt(clip_1e12.p_sol_over_astra)` at 10<sup>−12</sup>. A tighter clip treats Sol's perfect score on FrontierMath Tier 4 as ever stronger evidence.
```{python}
#| label: fig-clip
#| fig-cap: "The probability that GPT-6.1 Sol is ahead of GPT-6 Astra in full refits of Epoch's model, by clip. The labels give Sol's lead in ECI points. The diamond shows the extended-support beta result (XB, described below), placed at the clip it resembles at the boundary, δ / (1 + 2δ)."
# x is the number of nines in the upper clip point 1 - c, i.e. -log10(c), so right is closer to 100%.
nines = -np.log10(clips.index.to_numpy())
fig = go.Figure()
fig.add_scatter(x=nines, y=clips.p_sol_over_astra, mode="lines+markers+text", line=dict(color=BLUE, width=2),
marker=dict(color=BLUE, size=[12 if c == 0.001 else 8 for c in clips.index]), # Epoch's clip larger
text=[fmt(v, "+.2f") for v in clips.sol_minus_astra], textposition="top center", textfont=dict(size=11),
customdata=np.column_stack([[clip_label(c) for c in clips.index],
clips.sol_minus_astra]),
hovertemplate="clip %{customdata[0]}<br>P(6.1 Sol ahead) %{y:.2f}<br>Sol − Astra %{customdata[1]:+.2f}<extra></extra>")
x_xb = -np.log10(st.delta / (1 + 2 * st.delta))
fig.add_scatter(x=[x_xb], y=[xb.p_sol_over_astra], mode="markers", marker=dict(symbol="diamond", size=12, color=ORANGE),
hovertemplate=f"XB<br>P(6.1 Sol ahead) %{{y:.2f}}<br>Sol − Astra {xb.sol_minus_astra:+.2f}<extra></extra>")
fig.add_annotation(x=x_xb, y=xb.p_sol_over_astra, axref="x", ayref="y", ax=1.8, ay=0.85, text=f"XB ({fmt(xb.sol_minus_astra, '+.2f')}),<br>at the clip it acts like",
font=dict(color=ORANGE, size=12), arrowcolor=ORANGE, align="left", xanchor="left")
fig.add_annotation(x=3, y=epoch.p_sol_over_astra, ax=60, ay=30, text="Epoch’s clip", font=dict(size=12), arrowcolor=MUTED)
fig.add_hline(y=0.5, line=dict(color=MUTED, width=1))
ticks = [2, 3, 4, 6, 8, 10, 12]
style(fig, 360, xaxis=dict(range=[1.6, 12.6], tickvals=ticks, ticktext=[nines_label(n) if n <= 4 else f"{n} nines" for n in ticks],
title="upper clip point (the bottom one mirrors it: 99.9% ↔ 0.1%)"),
yaxis=dict(range=[0, 1], dtick=0.25, title="P(6.1 Sol ahead of Astra)"))
show(fig)
```
```{python}
#| include: false
# The benchmarks both models have a score on where 6.1 Sol's is the higher. The chart below (astra_sol_panel.html) shows
# the same scores; both are written by viz/pair_panel.py (the scores as astra_sol_panel_scores.csv, copied here as
# astra_sol_scores.csv; see run_all.sh).
shared = scores.pivot(index="display", columns="model", values="performance").dropna()
sol_ahead = list(shared.index[shared[SOL] > shared[ASTRA]])
```
Tighter clips result in a higher ECI for GPT-6.1 Sol than GPT-6 Astra's even though Astra scores at least as high as 6.1 Sol on every shared benchmark except `{python} ", ".join(sol_ahead)`. @fig-scores below illustrates all benchmark scores that go into determining each model's ECI.[^tool]
::: {#fig-scores}
```{=html}
<iframe class="eci-frame" src="astra_sol_panel.html" style="width:100%;height:860px;border:0" scrolling="no"></iframe>
```
GPT-6 Astra's and GPT-6.1 Sol's scores on each benchmark (as Epoch rescales them; the higher in bold), each placed at the ECI that score implies under Epoch's current method (the capability at which it would be most likely). Each line runs from 0.1% to 99.9% (so Epoch's clip assigns a 100% score to its right end), with ticks at 10%, 20%, …, 90%. Dashed lines show the two models' ECIs.
:::
[^tool]: In a future post, I plan to provide a tool for comparing any two models benchmark by benchmark, also showing how much each score affects the models' ECIs.
```{python}
#| include: false
# FrontierMath Tier 4's scale, as in the benchmark chart: what a score implies (the ECI at which it is most likely).
# Epoch's beta for a score with expected value mu is Beta(mu kappa, (1 - mu) kappa); the curve (published difficulty
# and slope, kappa from my rerun) is the one the chart uses, written by viz/pair_panel.py.
from math import lgamma
fm4_curve = pd.read_csv("astra_sol_panel_curves.csv").set_index("display").loc["FrontierMath Tier 4"]
_eci = np.arange(fm4_curve.mid_eci - 40, fm4_curve.mid_eci + 40, 0.002)
_mu = 1 / (1 + np.exp(-fm4_curve.alpha_eci * (_eci - fm4_curve.mid_eci))) # expected score at each ECI
_a, _b = _mu * fm4_curve.kappa, (1 - _mu) * fm4_curve.kappa
_log_beta_fn = np.array([lgamma(a) + lgamma(b) - lgamma(a + b) for a, b in zip(_a, _b)])
def implied(score, clip=1e-3):
"""What a FrontierMath Tier 4 score implies: the ECI at which it is most likely, and the expected score there."""
y = min(max(score, clip), 1 - clip)
best = np.argmax((_a - 1) * np.log(y) + (_b - 1) * np.log1p(-y) - _log_beta_fn)
return _eci[best], _mu[best]
astra_eci = implied(st.fm4_astra)[0]
```
## How the clip impacts ECI estimates
What the clip choice directly changes is the placement of a perfect score on the ECI scale. @fig-perfect below shows the row for FrontierMath Tier 4 from the benchmark comparison of Astra and Sol above, redrawn for four different clips:^[The benchmark's difficulty and slope are held fixed for illustrative purposes here, though in a full refit they adjust in response to the clip changes.] Astra's `{python} out_of_fm4(st.fm4_astra)` implies an ECI around `{python} fmt(astra_eci, ".0f")` regardless. Sol's perfect `{python} out_of_fm4(st.fm4_sol)` has no place on the scale unless it is clipped, so where it lands depends on the clip: `{python} fmt(implied(1.0, 1e-3)[0], ".0f")` with Epoch's 99.9%, `{python} fmt(implied(1.0, 1e-4)[0], ".0f")` with 99.99%, up to `{python} fmt(implied(1.0, 1e-12)[0], ".0f")` with twelve nines.
Nothing about the models differs between the rows. Sol solved the same `{python} st.fm4_questions` problems in each case. What differs is how much better than `{python} out_of_fm4(st.fm4_astra)` the ECI methodology is told a perfect score is. Under the original least-squares method the answer hardly mattered. Under the new Bayesian method, there is no natural limit to how much it matters: each tightening of the clip pushes the end of the scale further out.
```{python}
#| label: fig-perfect
#| fig-cap: "What a perfect score is worth depends on where it is clipped. Each line is FrontierMath Tier 4's scale from @fig-scores, marked at the ECI each score implies under Epoch's model. Astra's dot does not depend on the clip; GPT-6.1 Sol's 100% sits wherever the clip puts the end of the scale. Hover for details."
# One row per clip: the scale from the left edge to where the clip puts a 100% score, ticks at 50/75/90/99%,
# Astra's 97.6% (the same in every row) and Sol's 100%.
rows = [(1e-3, "99.9% (Epoch’s clip)"), (1e-4, "99.99%"), (1e-6, "99.9999%"), (1e-12, "twelve nines")]
ticks = [(p, implied(p)[0]) for p in (0.5, 0.75, 0.9, 0.99)]
both_eci = published[[ASTRA, SOL]].mean()
X0 = 157
fig = go.Figure()
for i, (clip, label) in enumerate(rows):
y = -i
sol_eci = implied(1.0, clip)[0]
fig.add_scatter(x=[X0, sol_eci], y=[y, y], mode="lines", line=dict(color=INK, width=1.5), hoverinfo="skip")
fig.add_scatter(x=[v for _, v in ticks], y=[y] * len(ticks), mode="markers", marker=dict(symbol="line-ns", size=10, line=dict(width=1.2, color=INK)),
customdata=[f"{p:.0%}" for p, _ in ticks], hovertemplate="a %{customdata} score implies %{x:.1f}<extra></extra>")
fig.add_scatter(x=[astra_eci], y=[y], mode="markers", marker=dict(size=10, color=ASTRA_COL),
hovertemplate=f"Astra: {out_of_fm4(st.fm4_astra)} implies %{{x:.1f}}<extra></extra>")
fig.add_scatter(x=[sol_eci], y=[y], mode="markers+text", marker=dict(size=12, color=SOL_COL), text=[fmt(sol_eci, ".1f")],
textposition="middle right", textfont=dict(color=SOL_COL),
hovertemplate=f"6.1 Sol: {out_of_fm4(st.fm4_sol)}, counted as {label}, implies %{{x:.1f}}<extra></extra>")
for p, v in ticks:
fig.add_annotation(x=v, y=0.55, text=f"{p:.0%}", showarrow=False, font=dict(size=11, color=MUTED))
fig.add_vline(x=both_eci, line=dict(color=INK, width=1, dash="dash"), opacity=0.6)
fig.add_annotation(x=both_eci, y=-len(rows) + 0.35, text="both models’ ECI", showarrow=False, xanchor="left", xshift=4, font=dict(size=11))
fig.add_annotation(x=X0, y=1.05, text=f"● Astra: {out_of_fm4(st.fm4_astra)}", showarrow=False, font=dict(color=ASTRA_COL), xanchor="left", xshift=4)
fig.add_annotation(x=X0, y=1.05, text=f"● 6.1 Sol: {out_of_fm4(st.fm4_sol)}", showarrow=False, font=dict(color=SOL_COL), xanchor="left", xshift=120)
style(fig, 330, margin=dict(l=150, r=20, t=10, b=50),
xaxis=dict(range=[X0, 187], dtick=5, title="ECI the score implies", showgrid=False),
yaxis=dict(range=[-len(rows) + 0.4, 1.4], tickvals=[-i for i in range(len(rows))], ticktext=[r[1] for r in rows],
showgrid=False, ticks="", title="A 100% is counted as"))
show(fig)
```
A more indirect way the clip affects results is that it raises the estimated scatter σ<sub>b</sub> of benchmarks with 0% (or 100%) scores, reducing their influence overall.^[A note in Epoch's code acknowledges this channel, explaining that the clip "is not a free numerical tolerance" because shrinking it "hands the likelihood an unbounded reward" for pushing 0% rows down, "and the model pays for it by lowering the capability of the models involved and raising the sigma of the benchmarks carrying the zeros." ([eci-public, `bayesian.py`](https://github.com/epoch-research/eci-public/blob/e04929a/src/eci/bayesian.py))] A benchmark's influence in determining ECIs falls roughly as 1/σ<sub>b</sub><sup>2</sup>. In particular, for Mystery Game Puzzles, with `{python} int(mystery.zeros)` scores of 0%, σ<sub>b</sub> is `{python} fmt(mystery["clip_0.001"], ".3f")` with Epoch's 0.1% clip, `{python} fmt(mystery["clip_0.0001"], ".3f")` with 0.01%, and `{python} fmt(mystery["clip_1e-12"], ".3f")` at 10<sup>−12</sup>.^[Its σ<sub>b</sub> under XB, described below, is `{python} fmt(mystery.xb, ".3f")`.] So a 0.01% clip would give it about `{python} fmt(mystery_weight_loss, ".0%")` less weight than Epoch's 0.1% does, whether intended or not.
Still, it is generally true that most ECI results are not sensitive to the clip choice. For instance, models at ECI 150+ move by only `{python} fmt(clip_001pct.frontier_mean_abs_change)` on average between the 0.1% and 0.01% clips (at most `{python} fmt(clip_001pct.frontier_max_abs_change)`).
## A simple fix: the extended-support beta (XB)
Fortunately, a small change to Epoch's new Bayesian methodology would allow for direct handling of 0% and 100% scores, eliminating the need for a clip. The idea is to extend the beta distribution (used to model the score on a given benchmark, given an ECI and other relevant parameters) to a slightly wider interval, [−δ, 1 + δ], and use the probability mass outside the [0, 1] interval to represent the probability of exact 0% or 100% scores.^[This approach is conceptually similar to the Censored Normal alternative likelihood Epoch tried, as reported in their post's [Appendix A](https://epoch.ai/publications/eci-bayesian-methodology#appendix).] [Kosmidis and Zeileis (2026)](https://doi.org/10.1093/jrsssc/qlaf039)^[Kosmidis and Zeileis (2026) *Journal of the Royal Statistical Society Series C* 75: 139–157 (open access).] call this the extended-support beta (XB),^[The model their paper actually recommends, XBX, is a continuous mixture of XB distributions in which the exceedance, δ, follows an exponential distribution with unknown mean ν. They say this shrinks XB towards the beta to avoid certain identifiability problems that do not arise here because δ is small and tightly estimated (and its estimate barely moves under tighter or flatter priors). As a check, I also fit XBX (estimating a mean exceedance ν of `{python} fmt(xbx.nu, ".2%")`). It gives broadly similar answers (Fable 5.2's gap above the trend `{python} fmt(xbx.fable_gap, ".1f")` against XB's `{python} fmt(fable["XB"], ".1f")`; 6.1 Sol − Astra `{python} fmt(-xbx.astra_minus_sol, "+.2f")` against `{python} fmt(xb.sol_minus_astra, "+.2f")`) and fits slightly better (log predictive density `{python} fmt(xbx.loo_diff, "+.1f")`, SE `{python} fmt(xbx.loo_se, ".1f")`)---but not enough to justify the additional conceptual complexity.] available in R's `betareg` since version 3.2-0.
The δ is estimated, not chosen like Epoch's current clip. For the current ECI data, it is estimated as `{python} fmt(st.delta, ".2%")` (90% interval `{python} fmt(st.delta_lo, ".2%")`–`{python} fmt(st.delta_hi, ".2%")`).^[One implication is that the latent mean now reaches 100% at a finite capability: `{python} fmt(st.reach_eci_median, ".0f")` ECI points above the median benchmark's 50% point.]
The results are broadly similar to the current official ECI, but models at ECI 150+ do shift by `{python} fmt(xb.frontier_mean_abs_change)` points on average, somewhat more than under any of the alternative clips considered above (at most `{python} fmt(clips.frontier_mean_abs_change.max())`). The largest change is for Fable 5.2 itself, whose ECI falls from `{python} fmt(fable_eci["clip_0.001"], ".1f")` to `{python} fmt(fable_eci["XB"], ".1f")`. But the trend line shifts down as well, so its gap above the trend falls by less (from `{python} fmt(fable["clip_0.001"], ".1f")` to `{python} fmt(fable["XB"], ".1f")`). XB's Astra v. 6.1 Sol result is in between that for the official ECI and a 1% clip, as shown in @fig-clip above.
### XB measures of fit
In terms of fit, the extended beta has overall log predictive density (PSIS-LOO) higher by `{python} fmt(st.loo_diff, ".1f")` (SE `{python} fmt(st.loo_se, ".1f")`).^[The two models' likelihoods cannot be compared directly because they treat 0% and 100% scores differently: Epoch's model assigns the clipped score a probability density, while XB assigns the exact 0% or 100% a probability. So I score both models on the same set of outcomes. A score of 0.1% or below counts as the event "bottom" and one of 99.9% or above as the event "top," and each model is credited with the probability it gives that event (for Epoch's model, its fitted beta's probability below 0.1% or above 99.9%). Every other score is credited with its density. (No observed benchmark score lies strictly between 0% and 0.1% or between 99.9% and 100%.) The measures in the table below apply the same convention to Epoch's model: a simulated score beyond its clip counts as an exact 0% or 100%.] Broken down, it's `{python} fmt(st.loo_boundary, "+.1f")` on 0% and 100% scores, but `{python} fmt(st.loo_interior, "+.1f")` on the rest. So the gain comes entirely from the 0% and 100% scores, whereas the scores in between are predicted somewhat worse.
The other measures below follow Epoch's report (main text and Appendix B).^[Note that the observed share of scores below 0.1%, the target of the final row, is `{python} fmt(st.n_zero / st.n_scores, ".1%")`.]
```{python}
#| output: asis
# The measures shown, in order, each with its number format (fit_metrics.csv also has in-sample values)
measures = {
"RMSE": ".4f", "MAE": ".4f", "median abs error": ".4f", "beta-scaled RMSE": ".4f", "CRPS": ".4f", "mean bias": "+.4f",
"coverage 90%": ".1%", "coverage 90%, scores <= 0.05": ".1%", "coverage 90%, scores >= 0.95": ".1%",
"coverage 50%": ".1%", "coverage 99%": ".1%", "PIT KS": ".3f", "predicted share < 0.1%": ".1%",
}
print(md_table(pd.DataFrame({
"Measure (PSIS-LOO)": list(measures),
"Epoch (0.1% clip)": [fmt(fit.loc[m, "epoch|PSIS-LOO"], spec) for m, spec in measures.items()],
"XB": [fmt(fit.loc[m, "xb|PSIS-LOO"], spec) for m, spec in measures.items()],
})))
```
The extended-beta is similar on accuracy and 90% coverage, closer on 99% coverage, and better on coverage near 0% (`{python} fmt(fit.loc["coverage 90%, scores <= 0.05", "xb|PSIS-LOO"], ".1%")` against `{python} fmt(fit.loc["coverage 90%, scores <= 0.05", "epoch|PSIS-LOO"], ".1%")`), a weak spot Epoch's report flags. Near 100%, both over-cover, though XB somewhat more, and its 50% coverage is a bit further off (`{python} fmt(fit.loc["coverage 50%", "xb|PSIS-LOO"], ".1%")` against `{python} fmt(fit.loc["coverage 50%", "epoch|PSIS-LOO"], ".1%")`). The beta-scaled RMSE is a weak point for XB, as is the posterior predictive check on the variance.
The relative weaknesses in XB's predictive fit are somewhat improved by a further extension (with one parameter more), tying δ to each benchmark's scatter, δ<sub>b</sub> = δ (σ<sub>b</sub> / median σ)<sup>γ</sup>.^[γ is estimated to be `{python} fmt(shift.gamma, ".1f")` (90% interval `{python} fmt(shift.gamma_lo, ".1f")`–`{python} fmt(shift.gamma_hi, ".1f")`), so δ<sub>b</sub> runs from `{python} fmt(shift.delta_b_min, ".2%")` (`{python} shift.delta_b_min_bench`) to `{python} fmt(shift.delta_b_max, ".1%")` (`{python} shift.delta_b_max_bench`): noisier benchmarks hit 0% and 100% more often than one shared δ allows. It then predicts better (log predictive density `{python} fmt(shift.loo_diff, "+.1f")`, SE `{python} fmt(shift.loo_se, ".1f")`, over XB: `{python} fmt(shift.loo_boundary, "+.1f")` on 0% and 100% scores, `{python} fmt(shift.loo_interior, "+.1f")` on the rest). It has beta-scaled RMSE `{python} fmt(shift.bsrmse_shift, ".4f")` against `{python} fmt(shift.bsrmse_xb, ".4f")` (Epoch `{python} fmt(shift.bsrmse_epoch, ".4f")`); predictive p-value for the variance `{python} fmt(shift.ppp_var_shift)` against `{python} fmt(shift.ppp_var_xb)` (Epoch `{python} fmt(shift.ppp_var_epoch)`).] More broadly, the point here is not that XB is the ideal model but rather that at least one reasonable alternative to the ad hoc clip is available.
<!-- Additional notes on methods: Epoch's eci-public code at e04929a, nutpie sampler, 4 chains; clip refits 1,500 tuning + 2,000 draws per chain;
XB fit 1,000 + 1,000, PSIS-LOO only, no K-fold yet. -->
## Conclusions
In the end, Epoch's current ECI with a 0.1% clip yields results similar to my proposed extended beta, both in terms of Fable 5.2's jump above trend and the relative ratings of GPT-6 Astra and GPT-6.1 Sol. These similar results provide reassurance about the robustness of the current ECI's results. Alternatively, Epoch could adopt the more conceptually coherent XB approach (or a better alternative addressing XB's relative weaknesses in terms of predictive fit) and leave behind the need to choose a clip.
*Data: [Epoch AI Benchmarking Hub](https://epoch.ai/benchmarks) ([CC BY 4.0](https://creativecommons.org/licenses/by/4.0/)), as of November 10, 2026.*
*AI use: Opus 5.5 developed and ran all code. Fable 5.2 checked it, and I [provide it](https://github.com/hugetim/eci-clip-replication) for inspection. Opus 5.5 also, in conversation, suggested the extended beta alternative. The writing is mine.*
```{=html}
<script>
// size the embedded chart to the height it reports
window.addEventListener('message', e => {
if (!e.data || !e.data.eciFrameHeight) return;
document.querySelectorAll('iframe.eci-frame').forEach(f => {
if (f.contentWindow === e.source) f.style.height = (e.data.eciFrameHeight + 4) + 'px';
});
});
</script>
```